Our Resources
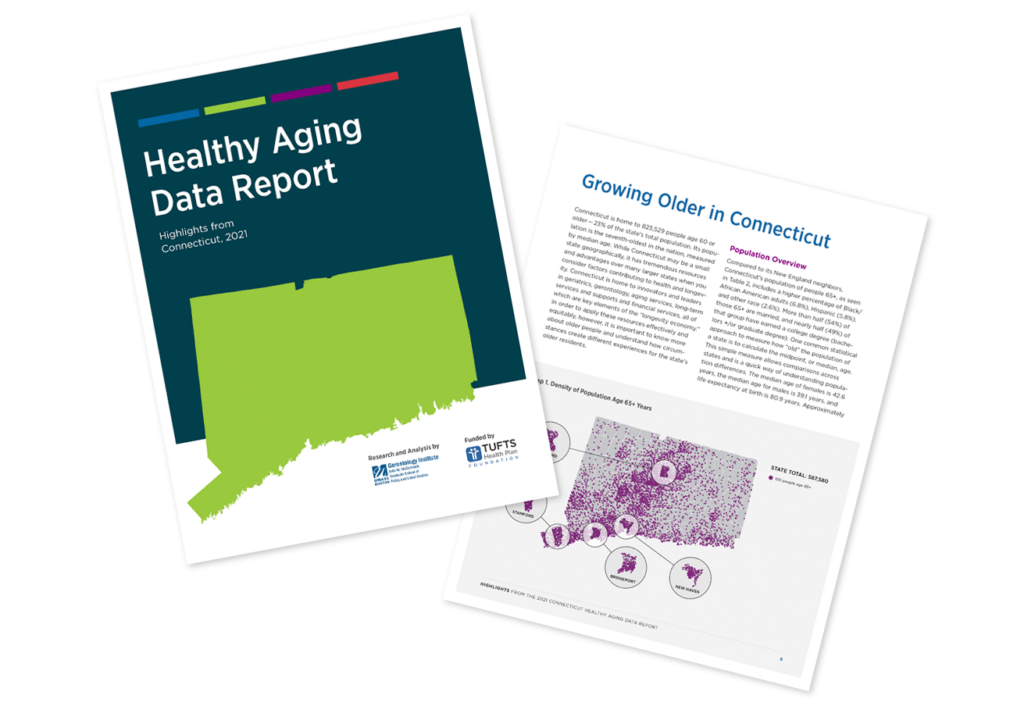
Healthy Aging Data Report
Detailed data about Connecticut’s changing demographics provides an important starting point for conversations about embracing opportunity and innovating systems to enable people to thrive across the lifespan.
In partnership with the Gerontology Institute of the John W. McCormack Graduate School of Policy and Global Studies at the University of Massachusetts and the Point32Health Foundation, the Collaborative released a first-of-its kind Connecticut Healthy Aging Data Report in 2021.
We encourage you to visit your community’s healthy aging profile. Each profile contains estimates for 190 health indicators, including population characteristics, wellness, falls, nutrition, chronic disease, behavioral health, mental health, disability, caregiving, access to care, service use, safety, transportation, and economic status.
In reviewing your profile, we also encourage you to consider the impact of race and ethnicity on healthy aging. The report distills data from 56 chronic disease, disability, and Medicare service use indicators to create a multidimensional measure of community aging. Among these, only four (heart attack, liver disease, PTSD and stroke) did not demonstrate racial disparities.
By the Numbers: Aging in Connecticut
Connecticut is the 7th oldest state in the United States.
16.4% of Connecticut residents are 65 or older.
14% of residents 65 or older live with dementia.
22% of adults in Connecticut live with at least one disability.
17.5% of residents 65 or older identify as people of color.
Explore the 2021 Report
This report is designed to help residents, agencies, lawmakers, and community leaders understand the older people who live in our cities and towns.
181 Community Profiles
All of Connecticut's 169 municipalities, as well as profiles for 12 specific neighborhoods (three each for Bridgeport, Hartford, New Haven and Stamford)
188 Maps
Community rates for healthy aging indicators, allowing viewers to observe patterns, strengths, and challenges across the state.
18 Interactive Online Maps
Town-by-town rates of chronic disease in residents age 65 and older, including Alzheimer's disease and related dementias, diabetes, stroke, hypertension, heart attacks, and others.
Summary Infographic
A snapshot of key findings from the 2021 Connecticut Healthy Aging Data Report.
Download the Highlights
The summary of highlights is an ideal starting point to explore the 2021 Connecticut Healthy Aging Data Report. It introduces the indicators that are reported and provides an overview of statewide trends.

